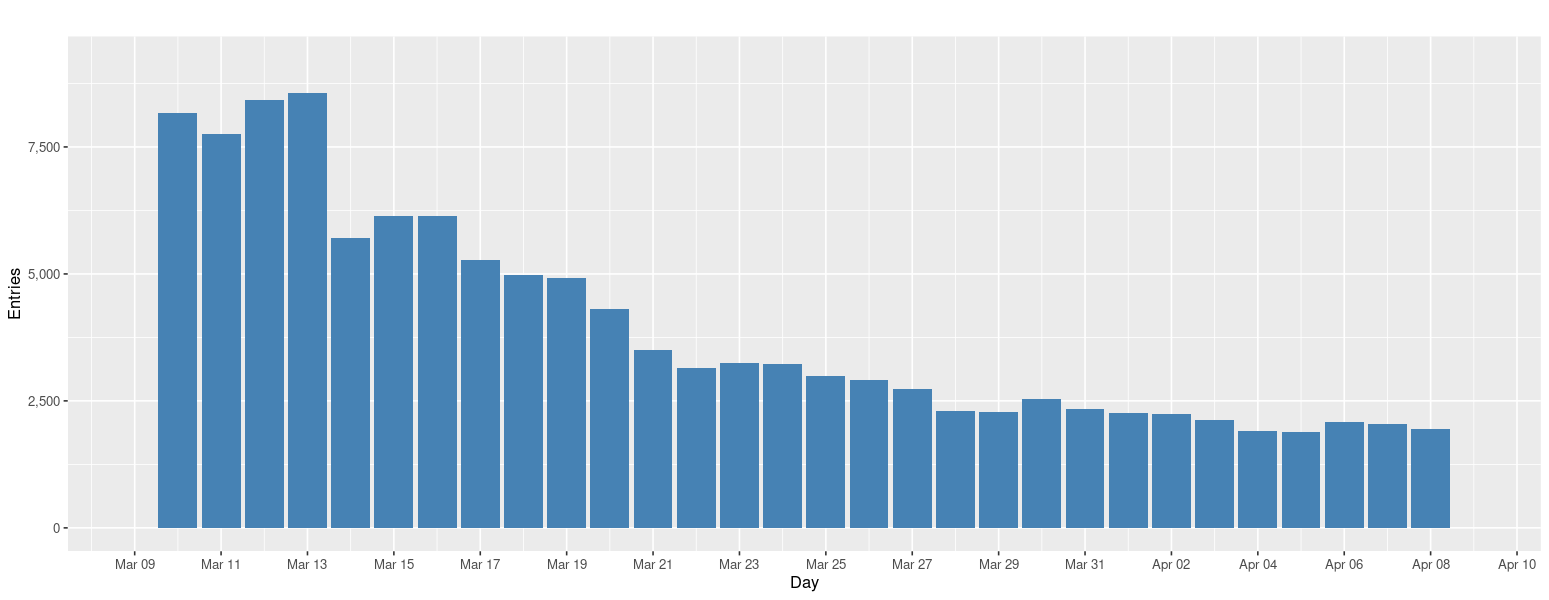
On this date, the governor of Illinois announced a lockdown in the state the data displayed was for O'Hare station and as we can see there is a decline in the no. of rides from March 20th, 2020. This decline can be observed in the graph and also can be seen in the table below the date displayed in the table is in a random order to sort it please click on the up arrow on the side of the date column.
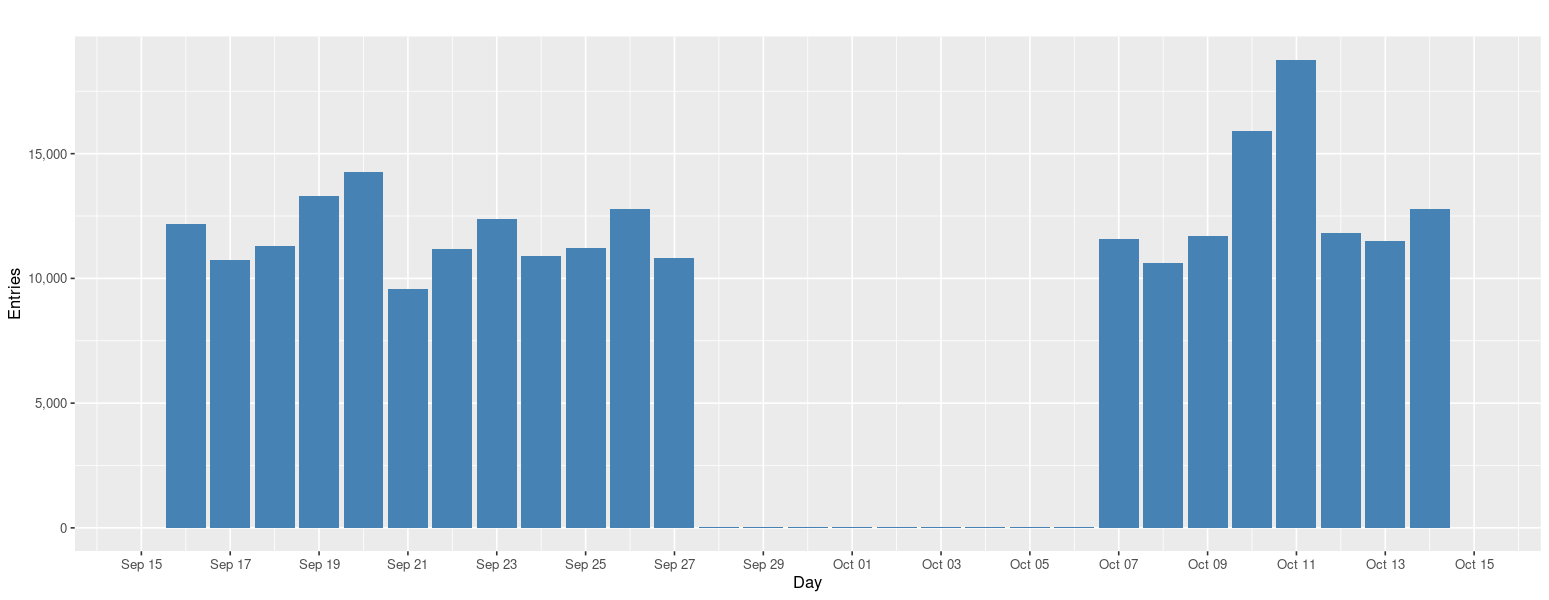
On this date, the operation of the blue line from Rosemont to O'Hare Airport was shut down for a period of nine days and the line started again on October 7 this can be seen in the graph below O'Hare station data was used for this graph. The line was shut down because of signal improvements to operate efficiently.
On this date, Barack Obama became the 44th president of United States and delivered his victory speech in Grant Park Chicago before an estimated crowd of 240,000. So the data for this graph was taken from Harrison station which is close to Grant Park and we can see that on November 4th there was a peak in the data.
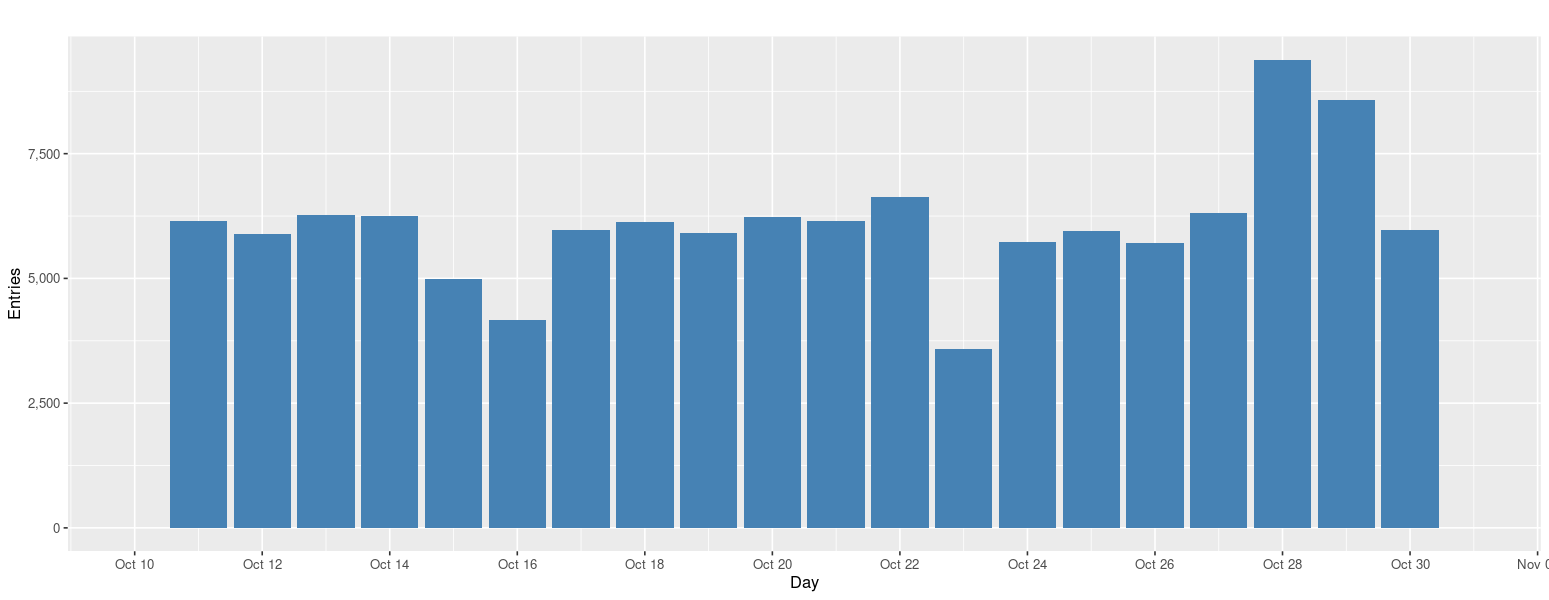
On this date, Cubs played Cleveland Indians in Wrigley field. The world series happened at Wrigley Field Chicago from October 28th to October 30th and each match had an attendance of 40000. So the data shown is of Sheridan station which is close to Wrigley field as we can see from the data October 28th had the peak and has decreased the following days.
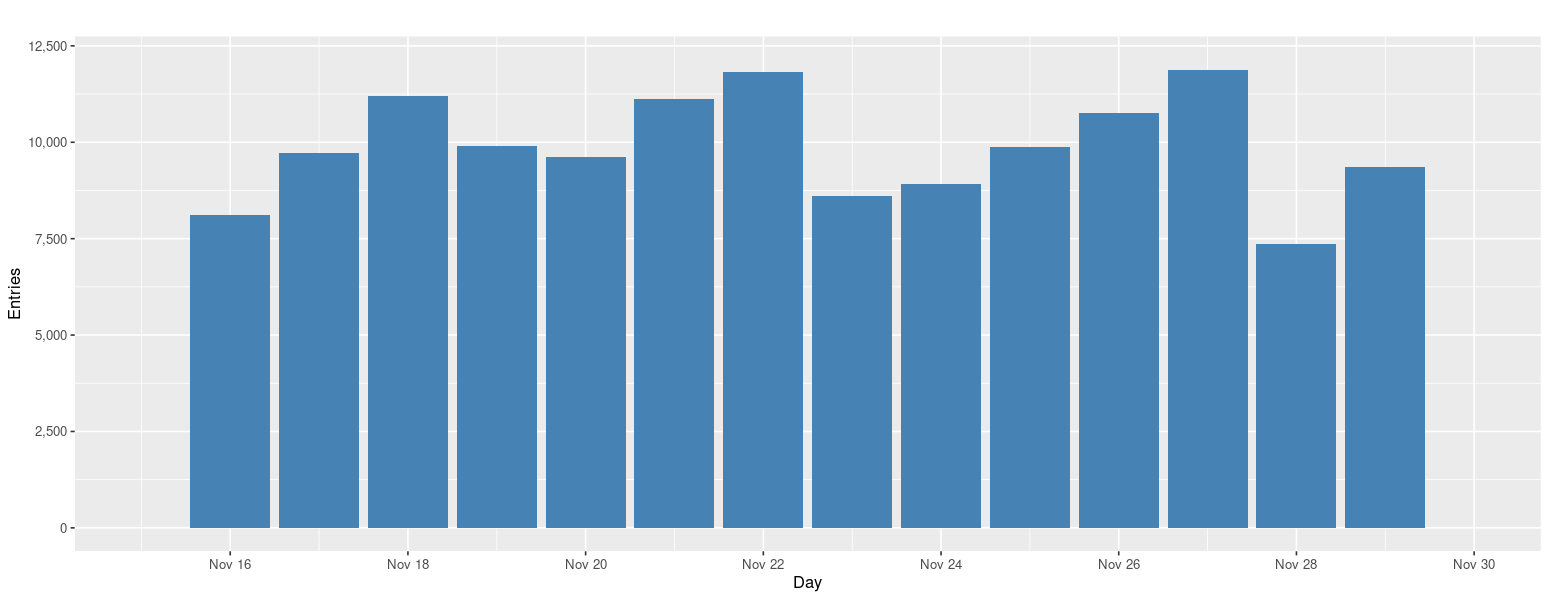
November 28th is Thanksgiving and it is followed by black Friday. For this date, I wanted to see if the number of people going to O'Hare Airport would increase or not as it was a long weekend. As we can see from the data after November 22nd we can see there is an increasing trend and then the number of entries was lowest on Thanksgiving.
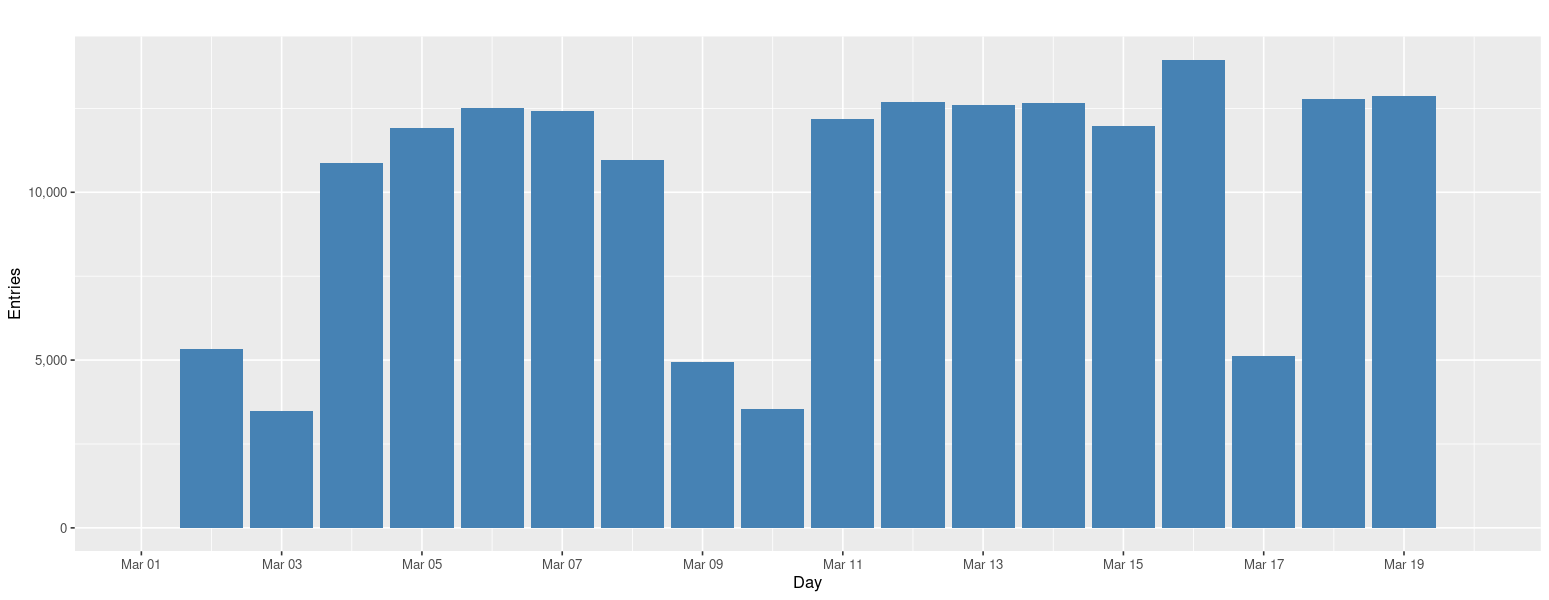
March 16th is St Patricks Day and in Chicago there is a parade and also River dying event which happens. So the data in the graph is of State/Lake station which is close to the parade. We can see from the graph that March 16th had a peak.
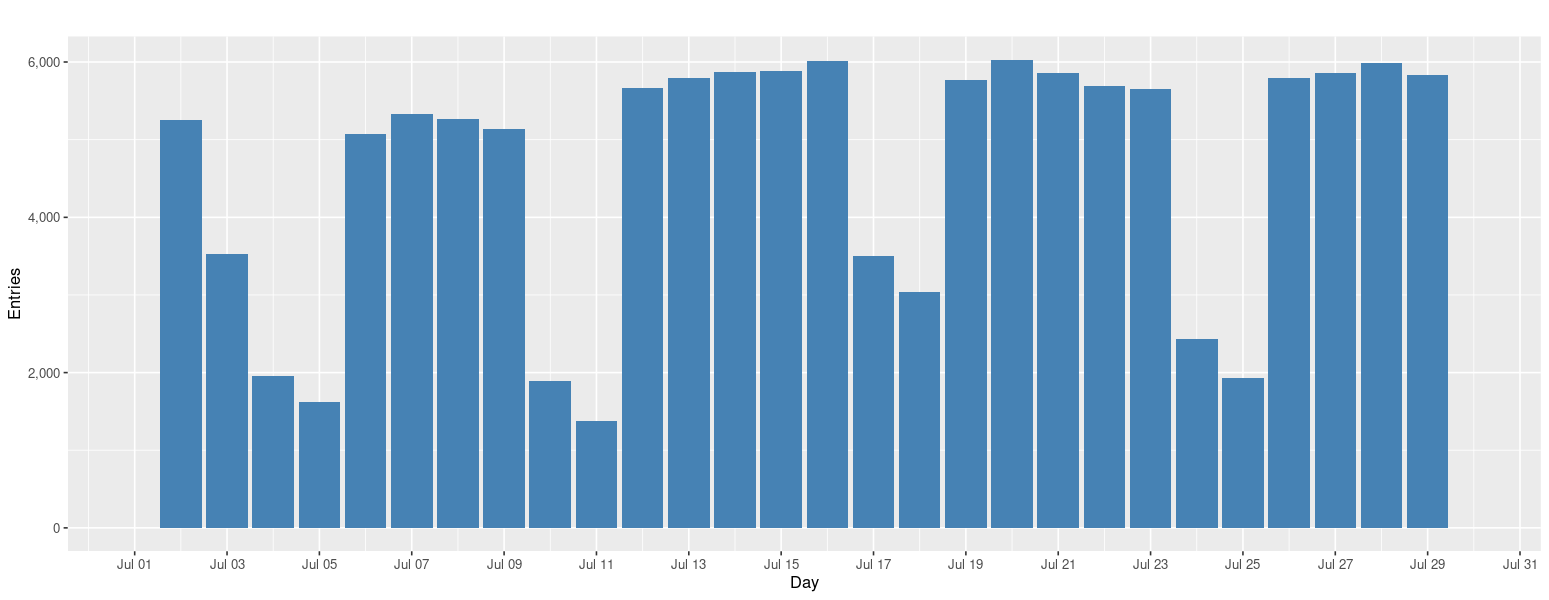
On this date Millinium Park opened in Chicago. I chose Randolph/Wabash station which is close to Millinium Park to see if there is increase in the number of entries. As we can see from the graph there was peak on July 16th.
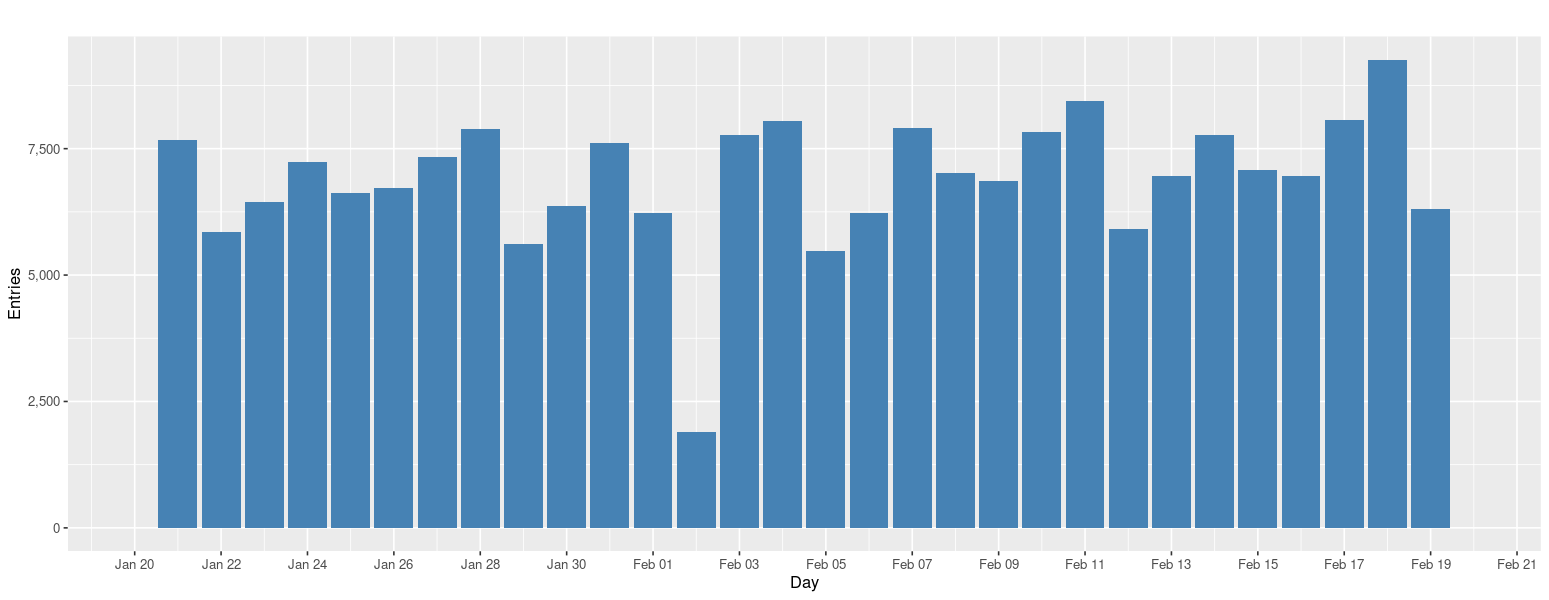
Febraury 2nd 2011 is known as Groundhog day blizzard was a powerful and historic winter storm that affected large swaths of the United States and Canada from January 31 to February 2, 2011.The Chicago area saw 21.2 inches (54 cm) of snow and blizzard conditions, with winds of over 60 mph (100 km/h). We can see that due the storm the number of entries decreased on Febraury 1st and 2nd being the lowest
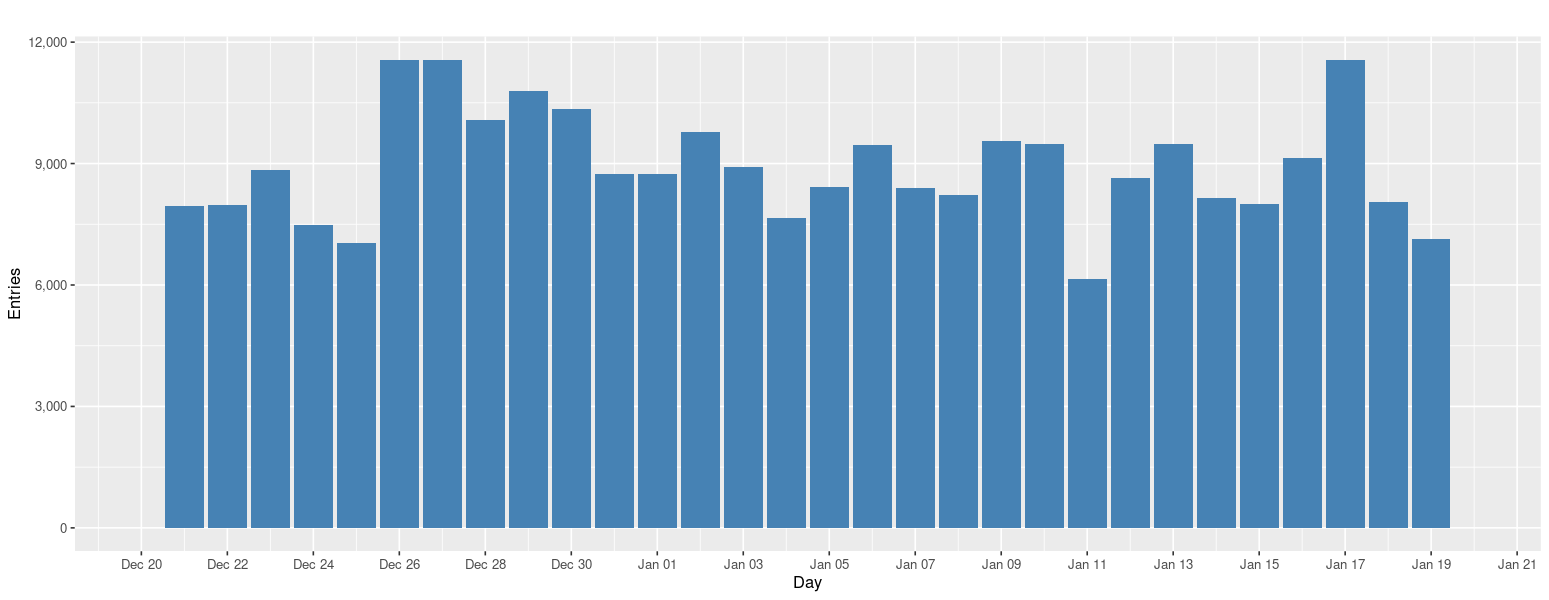
For this date which is Christmas I wanted to see if there was an increase in the number of people travelling as it was holiday season. So the graph was constructed using O'Hare data and as we can see after 25th there was an increase in travel as holidays start.
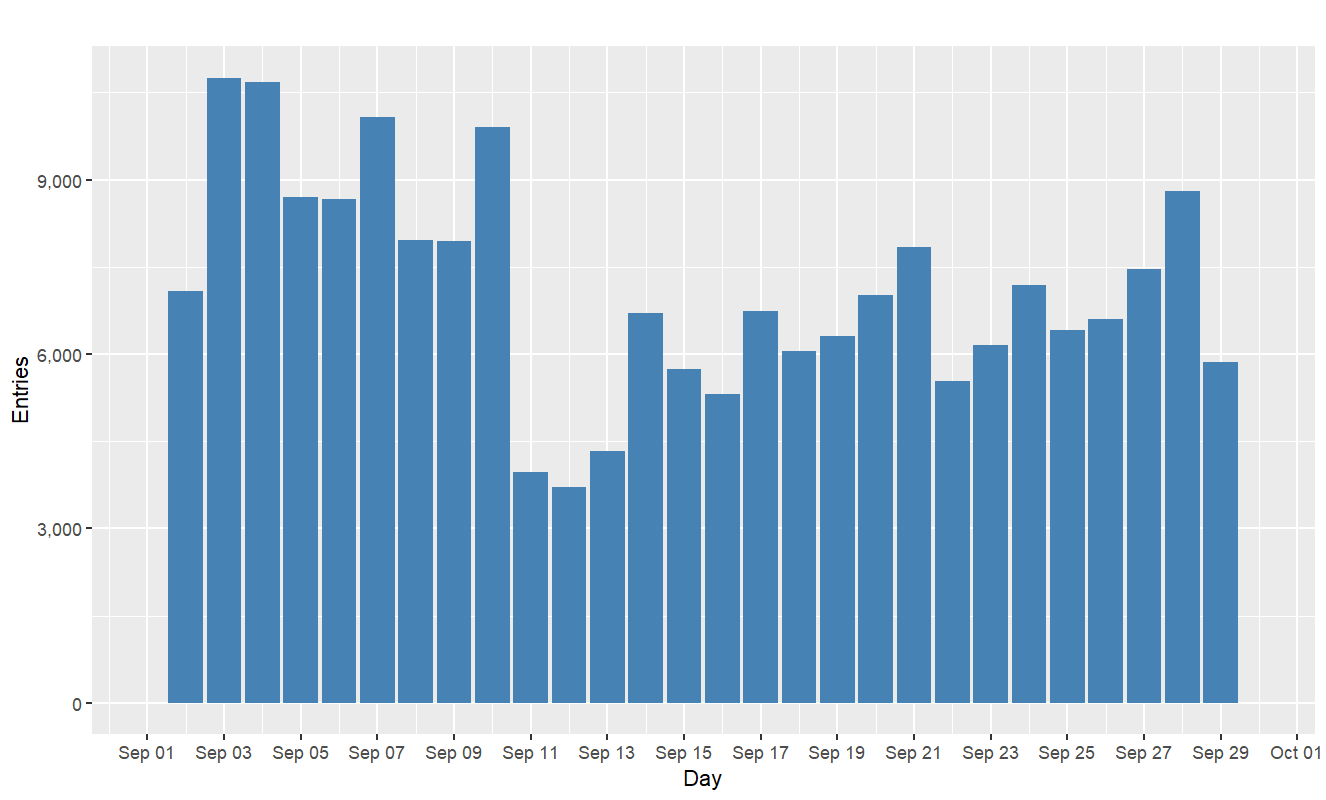
The September 11 attacks, also commonly referred to as 9/11,a were a series of four coordinated terrorist attacks by the militant Islamist terrorist group al-Qaeda against the United States. So I wanted to see if this effected the people travelling to O'Hare Airport. Looking at the graph we can see that at 12th the number of entries was the lowest and from then on there was a slow upward trend.